Inflation calculator India, with the inflation rate in India by year
Convert rupees between any two years since 1960 using India’s official consumer price inflation, project a future cost, or check the real return on an investment. Below it: the current inflation rate and every year’s rate since 1960.
Updated 19 October 2026 · CPI September 2026: 5.54% (provisional) · your figures never leave your browser
Value of money
Past values use India’s consumer price inflation: World Bank annual figures for 1960–2025 and, for 2026, MoSPI’s official index for January to September. Each year is that year’s average price level.
India’s retail inflation was 5.54% in September 2026 (provisional), up from 4.83% in August, by the Consumer Price Index that MoSPI publishes on its new 2024 base. Over the last ten calendar years prices rose 4.7% a year on average, and in 2025 inflation fell to 2.4%, the lowest annual rate since 1976. In money terms, ₹1 lakh in 2010 buys what about ₹2.42 lakh buys in 2026, and ₹1 lakh in 2000 what ₹4.46 lakh buys now. The calculator above gives these figures for any amount and any year since 1960, projects future costs, and shows the real return on an investment after tax and inflation.
- Current (CPI, September 2026): 5.54% provisional; rural 6.08%, urban 4.88%; food 7.74%
- 2026 so far: prices 4.0% higher than in the same months of 2025 (January–September average)
- 2025: 2.4%, the lowest since 1976
- Last 10 years (2016–2025): 4.7% a year on average
- RBI target: 4%, with a band of 2% to 6%, until March 2031
- New CPI base: 2024 = 100, used from January 2026
How the inflation calculator works
Value by year answers “what is money from year X worth in year Y?”. The calculator builds a price index from India’s official consumer price inflation for every year since 1960 and scales your amount by the change: value in year Y = amount × price level in Y ÷ price level in X. It also shows the total rise in prices and the average yearly rate between the two years.
Future cost applies a rate you choose: future cost = today’s cost × (1 + inflation)years. At 5% a year, a cost doubles in about 14 years. Real return shows what an investment earns once tax and inflation are taken out: real return = (1 + return after tax) ÷ (1 + inflation) − 1.
Current inflation rate in India
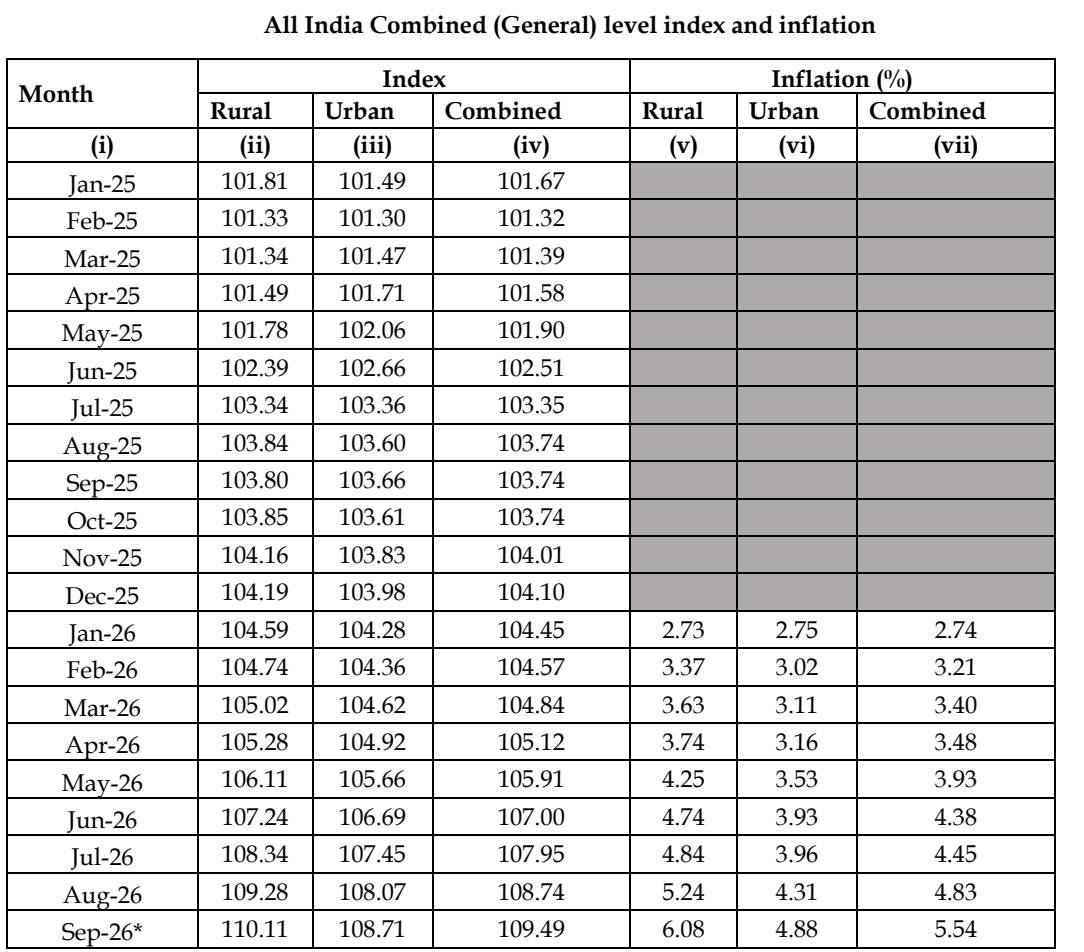
The Ministry of Statistics and Programme Implementation (MoSPI) publishes the Consumer Price Index each month, around the 12th. Its release for September 2026 put retail inflation at 5.54%:

That is the highest rate this year and inside the RBI’s 2% to 6% band. Food prices drove it: the food index was up 7.74%. Month by month on the new base:
| Month | CPI (2024 = 100) | Inflation |
|---|---|---|
| Jan 2026 | 104.45 | 2.74% |
| Feb 2026 | 104.57 | 3.21% |
| Mar 2026 | 104.84 | 3.40% |
| Apr 2026 | 105.12 | 3.48% |
| May 2026 | 105.91 | 3.93% |
| Jun 2026 | 107.00 | 4.38% |
| Jul 2026 | 107.95 | 4.45% |
| Aug 2026 | 108.74 | 4.83% |
| Sep 2026 | 109.49 | 5.54% |
Inflation rate in India by year
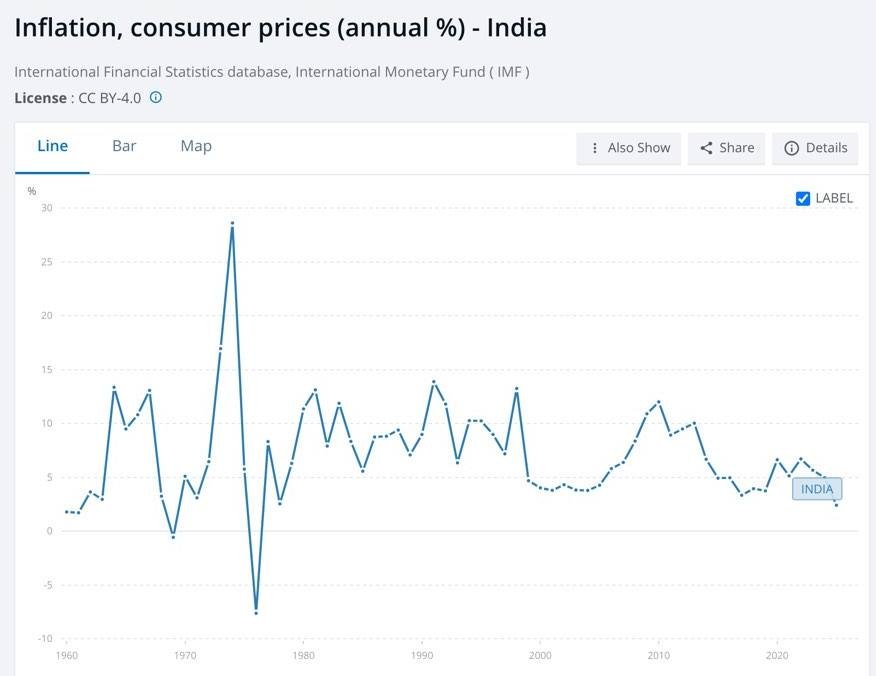
Annual consumer price inflation for India from the World Bank’s series, which it compiles from the IMF’s International Financial Statistics. Each figure is the change in the average price level of the calendar year:
Last 10 years
| Year | Inflation |
|---|---|
| 2025 | 2.40% |
| 2024 | 4.95% |
| 2023 | 5.65% |
| 2022 | 6.70% |
| 2021 | 5.13% |
| 2020 | 6.62% |
| 2019 | 3.73% |
| 2018 | 3.94% |
| 2017 | 3.33% |
| 2016 | 4.95% |
Prices rose by 4.7% a year on average over these ten years, with the highest rate (6.7%) in 2022 and the lowest (2.4%) in 2025.
Every year since 1960
| Year | Inflation | Year | Inflation | Year | Inflation |
|---|---|---|---|---|---|
| 2025 | 2.40% | 2003 | 3.81% | 1981 | 13.11% |
| 2024 | 4.95% | 2002 | 4.30% | 1980 | 11.35% |
| 2023 | 5.65% | 2001 | 3.78% | 1979 | 6.28% |
| 2022 | 6.70% | 2000 | 4.01% | 1978 | 2.52% |
| 2021 | 5.13% | 1999 | 4.67% | 1977 | 8.31% |
| 2020 | 6.62% | 1998 | 13.23% | 1976 | -7.63% |
| 2019 | 3.73% | 1997 | 7.16% | 1975 | 5.75% |
| 2018 | 3.94% | 1996 | 8.98% | 1974 | 28.60% |
| 2017 | 3.33% | 1995 | 10.22% | 1973 | 16.94% |
| 2016 | 4.95% | 1994 | 10.25% | 1972 | 6.44% |
| 2015 | 4.91% | 1993 | 6.33% | 1971 | 3.08% |
| 2014 | 6.67% | 1992 | 11.79% | 1970 | 5.09% |
| 2013 | 10.02% | 1991 | 13.87% | 1969 | -0.58% |
| 2012 | 9.48% | 1990 | 8.97% | 1968 | 3.24% |
| 2011 | 8.91% | 1989 | 7.07% | 1967 | 13.06% |
| 2010 | 11.99% | 1988 | 9.38% | 1966 | 10.80% |
| 2009 | 10.88% | 1987 | 8.80% | 1965 | 9.47% |
| 2008 | 8.35% | 1986 | 8.73% | 1964 | 13.36% |
| 2007 | 6.37% | 1985 | 5.56% | 1963 | 2.95% |
| 2006 | 5.80% | 1984 | 8.32% | 1962 | 3.63% |
| 2005 | 4.25% | 1983 | 11.87% | 1961 | 1.70% |
| 2004 | 3.77% | 1982 | 7.89% | 1960 | 1.78% |
The World Bank publishes this as one series from the IMF’s statistics, so its figure for a year can differ slightly from one quoted by MoSPI, and from figures for financial years (April to March).
What money from past years is worth today
₹1 lakh from each year, in 2026 money (2026 at its January–September price level):
| ₹1 lakh in | Is worth in 2026 | Prices rose | Per year |
|---|---|---|---|
| 1990 | ₹10.56 lakh | 956% | 6.8% |
| 2000 | ₹4.46 lakh | 346% | 5.9% |
| 2005 | ₹3.67 lakh | 267% | 6.4% |
| 2010 | ₹2.42 lakh | 142% | 5.7% |
| 2015 | ₹1.65 lakh | 65% | 4.7% |
| 2020 | ₹1.32 lakh | 32% | 4.8% |
| 2024 | ₹1.06 lakh | 6% | 3.2% |
Inflation meaning
Inflation is the rate at which prices in general rise, so that each rupee buys a little less than it did. It is measured by tracking the price of a fixed basket of goods and services over time. If the basket cost ₹100 last year and ₹105 now, inflation is 5%. The opposite, a fall in the general price level, is deflation; India last had it in 1976.
- CPI (Consumer Price Index): retail prices paid by households, compiled by MoSPI for rural, urban and all-India. This is the “headline” inflation figure and the one the RBI targets.
- WPI (Wholesale Price Index): prices at the wholesale level, compiled by the Office of the Economic Adviser in the Ministry of Commerce and Industry.
- Headline vs core: headline inflation covers the whole basket; core inflation leaves out food and fuel, whose prices swing the most, to show the underlying trend.
Types of inflation
- Demand-pull: demand for goods and services runs ahead of what the economy can supply.
- Cost-push: costs of production rise (fuel, wages, raw materials) and firms pass them on.
- Built-in (wage-price spiral): workers expect higher prices and seek higher wages, which push prices up again.
- By speed: creeping (a few percent a year), walking, galloping (double digits) and hyperinflation (prices rising so fast that money loses its use).
- Stagflation: high inflation together with weak growth and rising unemployment.
The RBI’s inflation target
Under section 45ZA of the Reserve Bank of India Act, 1934, the government sets an inflation target every five years, and the RBI’s Monetary Policy Committee sets interest rates to meet it. The current target, renewed in March 2026, is 4% CPI inflation with a tolerance band of 2% to 6%:

Beating inflation: the real return
A return only adds to what you can buy if it beats inflation after tax. A fixed deposit paying 7% to someone in the 30% bracket earns 4.9% after tax; with inflation at September 2026’s 5.54%, that is a real return of -0.6%, so the deposit loses buying power. Use the “Real return” tab for your own numbers. For mutual funds, where gains are taxed only when you sell and at capital-gains rates, the LTCG calculator and the SWP calculator show the tax; the SWP calculator also raises your withdrawal each year to keep up with inflation.
Cost Inflation Index is not the inflation rate
The Cost Inflation Index (CII) used in capital-gains tax is a separate number. The government notifies it each year at 75% of the average rise in the urban consumer price index (section 72 of the Income-tax Act, 2025); for 2026-27 it is 384. It is used to index the cost of property bought before 23 July 2024, and the full table is on our LTCG page.
महंगाई (मुद्रास्फीति) का मतलब
महंगाई या मुद्रास्फीति (inflation) का मतलब है चीज़ों और सेवाओं के दामों का लगातार बढ़ना, जिससे हर रुपये से पहले के मुक़ाबले कम सामान आता है। भारत में खुदरा महंगाई उपभोक्ता मूल्य सूचकांक (CPI) से मापी जाती है, जिसे सांख्यिकी मंत्रालय (MoSPI) हर महीने जारी करता है। सितंबर 2026 में महंगाई दर 5.54% (अस्थायी) रही। पिछले दस सालों में औसत महंगाई लगभग 4.7% सालाना रही, यानी 2010 के ₹1 लाख की क़ीमत आज लगभग ₹2.42 lakh के बराबर है। रिज़र्व बैंक का लक्ष्य 4% है, जिसमें 2% से 6% तक की छूट है।
Common questions
5.54 percent in September 2026 (provisional), by the all-India Consumer Price Index on the new 2024 base, published by MoSPI on 12 October 2026. It was 4.83 percent in August 2026. Rural inflation was 6.08 percent, urban 4.88 percent and food 7.74 percent.
2.4 percent for calendar 2025, by the World Bank's consumer price series, the lowest annual rate since 1976.
4.7 percent a year from 2016 to 2025, ranging from 2.4 percent in 2025 to 6.7 percent in 2022.
About ₹2.42 lakh in 2026 money. Prices rose about 142 percent between 2010 and the first nine months of 2026.
As the percentage change in a price index: (index this period minus index a year earlier) divided by the index a year earlier, times 100. India's retail inflation uses the Consumer Price Index; September 2026's index was 109.49 against 103.74 a year earlier, a rise of 5.54 percent.
4 percent CPI inflation, with a tolerance band of 2 to 6 percent, notified by the government on 25 March 2026 for the five years to March 2031 under section 45ZA of the RBI Act.
CPI measures retail prices paid by households and is compiled by MoSPI; it is the headline inflation measure the RBI targets. WPI measures wholesale prices and is compiled by the Office of the Economic Adviser in the Ministry of Commerce and Industry.
By cause: demand-pull, cost-push and built-in (wage-price) inflation. By speed: creeping, walking, galloping and hyperinflation. Stagflation is high inflation with weak growth.
No. The Cost Inflation Index is notified each year for capital-gains tax, at 75 percent of the average rise in urban consumer prices; for 2026-27 it is 384. It is used to index the cost of property bought before 23 July 2024.
India's consumer price inflation from the World Bank for 1960 to 2025, and MoSPI's official all-India CPI for January to September 2026. Values are based on each year's average price level.
- MoSPI — Press release of CPI (base 2024=100) for September 2026, 12 October 2026
- World Bank — Inflation, consumer prices (annual %), India
- Reserve Bank of India — Inflation Targeting in India: The Past, The Present and The Future (speech, 5 May 2026)
Figures checked against the sources on 19 October 2026. September 2026 is provisional and MoSPI may revise it next month. The 2026 values in the calculator use January–September and will change as the year’s data arrive. General information, not investment advice.